'The UKIRT Infrared Deep Sky Survey ZYJHK Photometric System:
Passbands and Synthetic Colours' (Hewett et al., 2006, astro-ph/0601592)
The paper Hewett et al. (2006, MNRAS, in press) is available here as a pdf file (416kb). The paper
contains a large number of long tables. These tables, providing the
filter transmission functions (if you wish to produce your own
synthetic colours), and all the synthetic colours, are available in a tar file of ascii files
(188kb). The abstract of the paper is provided below, followed by
the main figures (following the numbering in the paper), to illustrate
the contents.
Abstract: The UKIRT Infrared Deep Sky Survey is a
set of five surveys of complementary combinations of area, depth, and
Galactic latitude, which began in 2005 May. The surveys use the UKIRT
Wide Field Camera (WFCAM), which has a solid angle of
0.21deg2. Here we introduce and characterise the ZYJHK
photometric system of the camera, which covers the wavelength range
0.83-2.37µm. We synthesise response functions for the 5
passbands, and compute colours in the WFCAM, SDSS and 2MASS bands, for
brown dwarfs, stars, galaxies and quasars of different types. We
provide a recipe for others to compute colours from their own spectra.
Calculations are presented in the Vega system, and the computed
offsets to the AB system are provided, as well as colour equations
between WFCAM filters and the SDSS and 2MASS passbands. We highlight
the opportunities presented by the new Y filter at 0.97-1.07µm
for surveys for hypothetical Y dwarfs (brown dwarfs cooler than T),
and for quasars of very-high redshift, z>6.4.

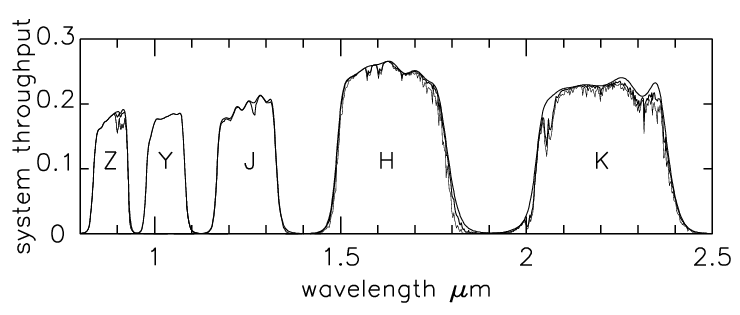
Figure 1. Transmission
curves, from above atmosphere to detector, for the WFCAM filter
set. Three curves are shown for each band. The upper, thick, curve is
for no atmospheric absorption. The middle, thick, curve is for the
default atmospheric conditions (1.3 airmass, 1.0mm water), and the
lower, thin, curve is for extreme atmospheric conditions (2.0 airmass,
5.0 mm water). These curves have been computed on the basis of
measurement or modelling of the relevant wavelength-dependent
quantities. An overall wavelength-independent normalisation has been
applied to match the photon count rate measured for standard stars
with the instrument. The calculation is preliminary and the
wavelength-independent normalisation is subject to revision.

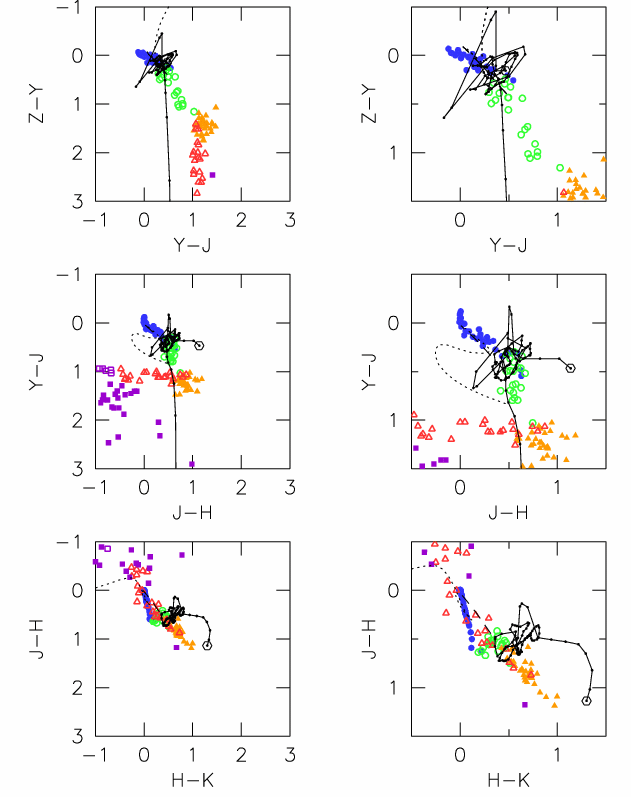
Figure 2. Top to bottom,
three 2-colour diagrams of stellar sources, cycling through the colour
sequence Z-Y, Y-J, J-H, H-K. Each right-hand panel is a 2X expanded
view of part of the corresponding left-hand panel. Key: BPGS O-K
dwarfs blue solid circles; M dwarfs green open circles; L dwarfs
orange solid triangles; T dwarfs red open triangles; Burrows model
cool brown dwarfs purple solid squares; Marley model cool brown dwarfs
purple open squares; quasars 0<z<8.5, Δz=0.1, solid black
line, z=0 marked by open hexagon; H white dwarfs dotted black line, He
white dwarfs dashed black line.

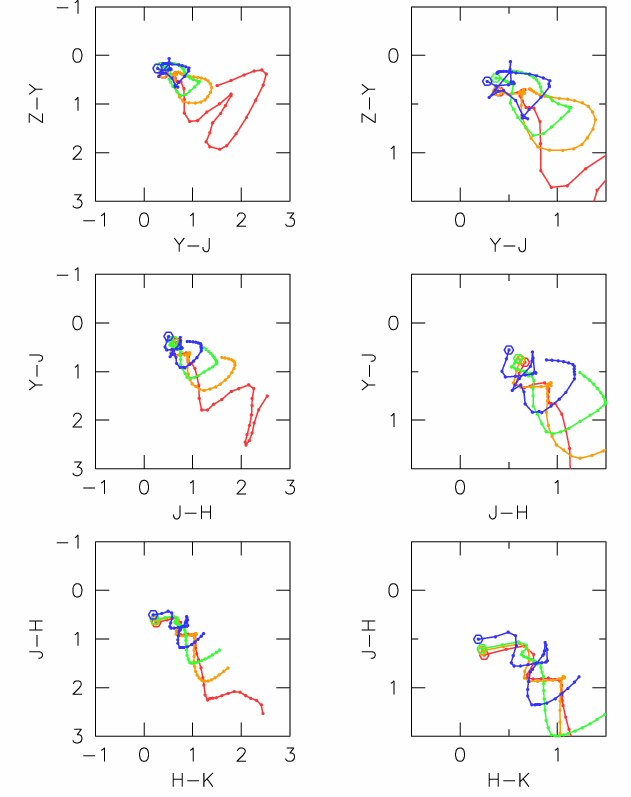
Figure 3. Top to bottom,
three 2-colour diagrams of hyperz galaxy templates, redshift
range 0<z<3.6, Δz=0.1, cycling through the colour sequence
Z-Y, Y-J, J-H, H-K. Each right-hand panel is a 2X expanded view of
part of the corresponding left-hand panel. Key: E red, Sbc orange, Scd
green, Im blue. For all curves z=0 is marked by an open hexagon.

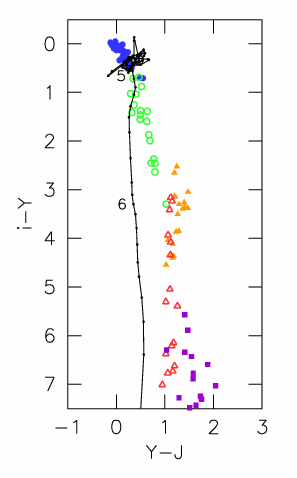
Figure 5. 2-colour diagram
illustrating colours of stars, brown dwarfs and quasars. Key: BPGS
O-K dwarfs blue solid circles; M dwarfs green open circles; L dwarfs
orange solid triangles; T dwarfs red open triangles; Burrows model
cool brown dwarfs purple solid squares; quasars 0<z<8.5,
Δz=0.1, solid black line, with redshifts 5 and 6 marked. In
this plot quasars 6<z<7.2 are identifiable as bluer than L and T
dwarfs in the Y-J colour. Note that the Marley model cool brown dwarfs
all have i-Y>7.5 and so lie off the plot.


