Filters
The standard filter complement for WFCAM comprises five broad-band
filters, Z, Y, J, H, and K, and two narrow-band 1% filters,
H2 1-0 S1, and Br-g. The manufacturer for the Z filter is
Research
Electro-Optics, Inc. The manufacturer for the remaining 6 filters
is NDC Infrared
Engineering. The eighth filter holder is blank, for darks. The
specified bandpasses for the eight filters are shown in Table 1. The
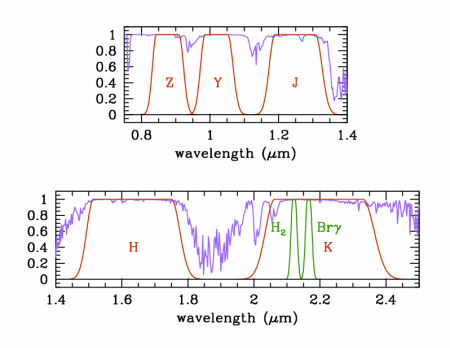
specified filter profiles are plotted in Fig. 1, which also shows the
wavelength dependence of the atmospheric transmission, for typical
conditions. The actual total system response curves, for the ZYJHK
bands, i.e. the transmission curves of the manufactured filters,
multiplied by atmospheric transmission, instrument throughput, and
detector q.e., are provided as ascii tables with the Hewett et
al. synthetic photometry paper (link 5. to the left).
The WFCAM J, H, and K bandpasses follow the specification of the Mauna
Kea consortium. The design of the MK filter set is described by
Tokunaga et al. (2002, PASP, 114, 180). The WFCAM Z filter has a
similar effective wavelength to the SDSS z' filter, and the WFCAM Y
filter fills the gap between Z and J. An explanation of the design of
the bandpasses for the Z and Y filters is provided below.
|
Z |
Y |
J |
H |
K |
H21-0 S1
1% |
Br-g
1% |
50% cut-on
(µm) |
0.83 | 0.97 | 1.17 | 1.49 |
2.03 | 2.111 | 2.155 |
50% cut-off
(µm) |
0.925 | 1.07 | 1.33 | 1.78 |
2.37 | 2.132 | 2.177 |
Table 1. Bandpasses of the 7 WFCAM
filters. The cut-on and cut-off wavelengths are specified at 50% of
peak transmission. The sharpness of the band edges is quantified by
[wav(0.8)-wav(0.05)]/wav(0.05), and is specified to be <0.025 (here
wav(0.8) is the wavelength where the transmission is 80% of peak).

Figure 1. The specified
transmission profiles of the WFCAM filter set, normalised to the peak
transmission, plotted against wavelength. The five broad-band
filters are plotted in red, and the two 1% narrow-band filters are
plotted in green. The lilac line plots the atmospheric transmission
(normalised to the continuum) for typical conditions.
Design of the WFCAM Z filter
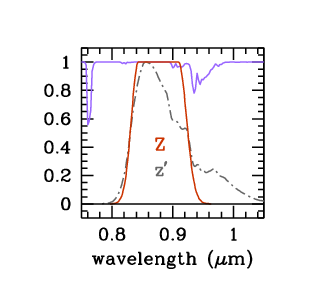
| The bandpass of the WFCAM Z filter (0.83-0.925µm) was designed
to provide a reasonable match to the effective wavelength of the SDSS
z' bandpass, but with a rectangular profile, and avoiding the
atmospheric absorption band near 0.95µm. The two bandpasses are
compared in Fig. 2. The specified WFCAM Z profile is shown in red. The
array quantum efficiency is approximately flat over this wavelength
range. The SDSS z' bandpass is defined by the long-pass z' filter and
the falling q.e. of the CCDs towards longer wavelengths, multiplied by
the atmospheric transmission. The normalised z' system throughput is
shown as the grey dash-dot line. The effective wavelengths of the
WFCAM Z and SDSS z' bandpasses are 0.876µm and 0.887µm,
respectively (effective wavelength as defined by Schneider et
al. (1993) ApJ, 264, 337). |

Figure 2. WFCAM Z filter. The red
line plots the specified profile of the WFCAM Z filter, normalised to
the peak transmission. The dash-dot grey line is the normalised system
throughput for the SDSS z' passband (Fan et al. (2001) AJ, 121,
31). The lilac line plots the atmospheric transmission (normalised to
the continuum) for typical conditions.
|
Design of the WFCAM Y filter
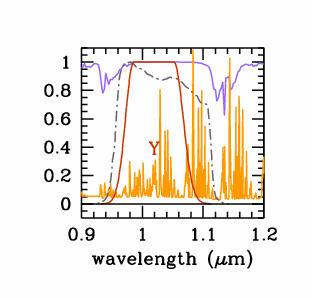
| The WFCAM Y filter (0.97-1.07µm) occupies the clean wavelength
range between the atmospheric absorption bands at 0.95µm and
1.14µm. The bandpass is similar to, but slightly narrower than,
the Y bandpass of Hillenbrand et al. (2002, PASP, 114, 708). The two
bandpasses are compared in Fig. 3. The WFCAM Y filter (shown red) has
a slightly redder cut-on wavelength than the Hillenbrand Y filter
(shown grey dash-dot), in order to be clear of the atmospheric absorption
band. The cut-off wavelength of the WFCAM Y filter is at a
significantly bluer wavelength, and largely avoids the strong sky
emission lines near 1.1µm. Not only does this reduce the sky
background, but it improves the Y-J colour discrimination between
high-redshift quasars and T dwarfs (as shown by Warren and Hewett (2002)). | 
Figure 3. WFCAM Y filter. The red line
plots the specified profile of the WFCAM Y filter, normalised to the
peak transmission. The dash-dot grey line is the normalised profile of
the Y filter of Hillenbrand et al. (2002, PASP, 114, 708). The orange
line shows the spectrum of the sky (units unspecified). The lilac line
plots the atmospheric transmission (normalised to the continuum) for
typical conditions. |


