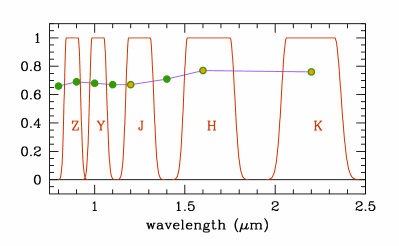
Figure 1. Measured quantum efficiency of the first WFCAM science-grade array as a function of wavelength.
The measured quantum efficiency of the first WFCAM science-grade array is tabulated below, and plotted against wavelength in the figure. The three yellow points are the q.e. values measured by Rockwell. The WFCAM project team are not able to make absolute q.e. measurements at the ATC. To extend the curve to shorter wavelengths, the green points, the q.e. variation with wavelength below 1.5µm was measured in a relative way, and this curve was normalised to the Rockwell measurement in the J band.
| wavelength (µm) | 0.8 | 0.9 | 1.0 | 1.1 | 1.2 | 1.4 | 1.6 | 2.2 |
|---|---|---|---|---|---|---|---|---|
| q.e. | 0.66 | 0.69 | 0.68 | 0.67 | 0.67 | 0.71 | 0.77 | 0.76 |

Figure 1.
Measured quantum efficiency of the first WFCAM science-grade array as a
function of wavelength.